
Graphs Tab (Portfolio Project)
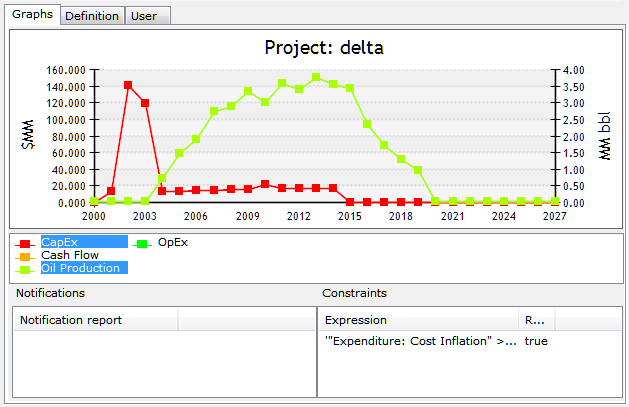
The Graphs tab available when a portfolio project is selected displays the data from the result file (.rlt) modified by the Start Year, Working and Net Interest defined in the project Definition Tab (Portfolio Project). See further under Simulation Graphs.
Selected scenario: In projects that take their data from Scenarios result files (scn.rlt), use this box to select which scenario should be used in the graph.
This tab also shows the Notifications and Constraints hat were triggered during calculation of the portfolio.